


Editor’s note: This is the first article from Damage Labs, my new independent publication about computing, graphics, performance, and AI.
Almost 15 years ago, I published my article “Inside the second: a new look at game benchmarking,” in which I proposed using frame-time-based analysis of gaming performance rather than just average FPS. Doing so has caused me all manner of trouble, most of it positive. In the years since, I’ve largely been working in the tech industry and haven’t had the time to comment publicly on new developments—of which there have been a great many.
I’ve recently found myself with some free time, so I thought I’d take a moment to walk through some of the more intriguing developments in the intervening years around frame-time-based benchmarking, animation smoothness, responsiveness, and more. There’s a whole grab-bag of topics to cover here, so indulge me, if you will.
Durable interest and real progress
I’m gratified to see enduring interest in frame-time-based metrics still showing up in GPU reviews and the like. Not everyone reports the same metrics; approaches vary widely, and it has been that way virtually from the beginning. I have always advocated simply for paying attention to frame times—as connected to animation smoothness experienced subjectively by the user—and avoiding the fundamental mistake of averaging out notable differences in performance. Which metrics folks choose to use is up to them (though I do have some opinions).
The software tools to capture frame-time data have improved, led by things like CapFrameX. I’m especially gratified when I see YouTubers and streamers using frame-time overlay tools and connecting their outputs to animation smoothness as they play. There was a (frankly somewhat ridiculous) time when we had to use slow-motion video cameras (which were then somewhat rare) to prove that a frame-time spike corresponded with a blip in game animation. With today’s visual tools and focus, everyone kind of gets it now.
I also have the sense that there’s been progress generally on the frontier of animation smoothness in gaming. Such progress is always kind of halting—shout-out to Unreal Engine 5—but with the right tools and metrics now more or less expected, the industry has been paying attention to, and optimizing for, the right targets. Over time, that fact has paid dividends, as has the fact that at least some of the key hardware bottlenecks have gotten faster (wider?) over time. So I’m going to call this one a provisional win, with the awareness that software bloat has an insatiable ability to absorb everything in its path if it’s not kept in check. (Shout-out to our near-future vibe-coded game engine components.)
Different flavors of 1% lows
One of the more popular frame-time metrics that you’ll see in reviews and such is the so-called 1% low FPS, typically reported alongside the FPS average as a sort of notable minimum number. The only problem with this situation is that, well, there are three entirely different metrics in use, all of which are getting labeled as “1% low” results.
The first of these metrics is just the 99th-percentile frame time number converted into FPS. To get this number, you must:
Record a series of frame-to-frame intervals (or frame times) during gameplay.
Sort the distribution from lowest to highest values.
Identify the frame time where 99% of all values in the distribution are faster; that is your 99th-percentile frame time (sometimes called the P99 value).
Divide 1000 milliseconds by that number to convert to frames per second. For example, if the 99th-percentile frame time is 50 milliseconds, 1000 / 50 works out to 20 FPS.
That’s one version of the 1% low. But, as I’ve learned from talking to smart folks like Steve Burke from GamersNexus, not everyone calculates the 1% low that way. Steve—and apparently a number of other folks—calculates it differently. Steps 1-2 are the same as above, but then this happens:
3. Isolate the slowest 1% of frames in the distribution and average them together.
4. Convert this number to FPS.
This difference is consequential. Instead of ruling out the slowest 1% of frames as potential outliers, this metric focuses exclusively on the slowest 1% of frames—the tail of the distribution—and averages them.
The third “1% low” metric focuses on a percentage of the total time represented in the distribution. Let’s work through the steps.
Record a series of frame-to-frame intervals during a 10-second gameplay sequence.
Sort the frame times from highest to lowest.
Beginning with the highest value, add the frame time values together until their cumulative total reaches or exceeds 100 ms—1% of the total test time.
Note the frame time that causes the cumulative total to reach or exceed that threshold.
Divide 1000 milliseconds by that value to convert to frames per second.
CapFrameX calls the GamersNexus method “1% low average” and this other, time-focused method “1% low integral.”
To get a sense of the practical differences between these metrics, I pointed Codex at one of my old review data directories and asked it to build a spreadsheet showing me the 1%-low and 0.1%-low numbers using all three methods. Here’s how that looks. Marvel at the very old GPU names.
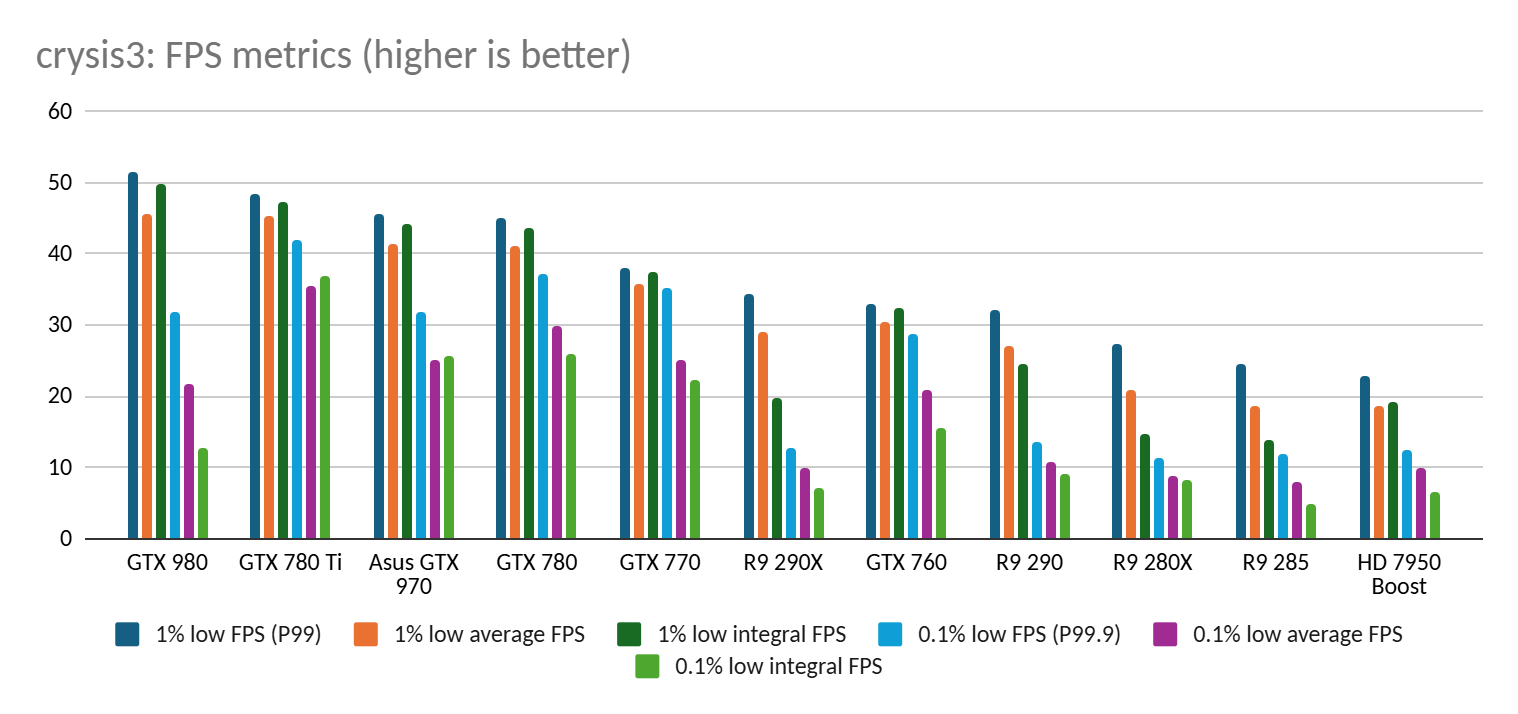
I’ve mentioned my concerns with averages, but perhaps counter-intuitively, I don’t hate the 1% low average metric. You can see it’s a more sensitive metric than the P99 one, producing lower FPS numbers thanks to its focus on the slowest frames. Given that we seem to have made progress with game smoothness optimizations over time, a more sensitive metric might be more appropriate to the current moment.
The 1% low average actually focuses on the tail data rather than just establishing a percentile cutoff point. Averaging the tail can hide very different kinds of slowness—huge, multi-second frame-time spikes could look the same as a more benign, persistent series of somewhat slow frames. But the same could be said for percentile cutoffs, and like them, this method can still flag problems and invite closer inspection.
The x% low integral appears to be an even more sensitive metric, particularly at the 0.1% cutoff point with a data set like this one, where there are substantial slowdowns in the extreme tail of the distribution. Again, the additional sensitivity of this method isn’t necessarily a bad thing. Depends on what you want to get out of it.
The obvious comment to make here is that we need to be disciplined about labeling results clearly and making sure we understand which metric is being used when discussing these things and, especially, when making comparisons.
Intervals vs. latency and input lag
Speaking of terminology, there is one clarification I’d like to put on the record. In my later articles involving frame-time testing, I talked about “frame latencies” and the importance of them. What I meant by “latency,” in that case, was simply the wait for the next frame of animation. I do think the wait for the next frame of animation is important, but talk of latency has since shifted mostly toward discussions of input lag—an adjacent but ultimately distinct topic.
I think it’s more helpful to talk about frame-to-frame intervals—or simply frame times—when discussing the progression and pacing of game animation. We can leave latency for the input lag discussion.
Huge progress on input lag
Speaking of which, another wonderful advance in this domain in recent years is the new focus on reducing input-to-response latency. I’m happy to say I was a part of the team that shipped Radeon Anti-Lag, one of the first software features to reduce unnecessary input lag in games. Nvidia followed shortly afterward with Ultra-Low Latency Mode and later Reflex, which moved latency optimization into the game engine. Crucially, they also supplied the industry with decent tools to measure input lag, a prerequisite to meaningful optimization.
I have to note that our team had plans to release latency testing hardware for the world to use first, but I’ve learned that getting things done inside of big companies can sometimes be quite challenging. Today, though, you can check out the Arduino Latency Meter here.
I suppose it’s worth giving you a few words about input lag reduction vs. animation frame times. The two things are obviously related, since new frames of animation carry the visual responses to one’s inputs.
I spent a fair amount of time testing Radeon Anti-Lag before we shipped it, and I have to say that the largest benefits were not what we marketed. Much of the marketing for any latency reduction feature is almost inevitably going to be focused on e-sports type games, since quick response times are huge in a competitive scenario. (And since e-sports games drive graphics card sales.) But in such a scenario, taking about a frame’s worth of wait time out of the input-to-response loop—which is what our feature did—typically isn’t worth much.
Why? Because the e-sports folks tend to crank down the visual settings to get super-high frame rates. At 240 FPS, a one-frame reduction in wait time only works out to four milliseconds. I’m not sure what the limits of human perception are on this front, but I’d wager we’re getting close to them.
Conversely, if you’re using a laptop with a weak integrated GPU struggling to run a demanding AAA game at 40 FPS, chopping out a frame of wait time can get you a 25-ms reduction in input lag. That, my friends, is frigging revolutionary for the playability of a game on a slow system. Everything feels so much more connected that even a setup averaging 40 FPS seems eminently viable instead of a total waste of time. The input-response loop is a huge component of perceived game fluidity and playability. I tested this very scenario multiple times before and after we shipped our software feature, and I wish we could have told the story of its benefits better.
Happily, the community now has tons of different tools for measuring input lag, and there is at least some effort on the part of GPU makers, display makers, and hopefully game developers to optimize for this target, as well. Even cheap TVs have a game mode, although the benefits are sometimes dubious.
FPS vs. frame times
The discussion above about relative benefits hints at another topic I’d like to address briefly. I’ve become increasingly convinced of the value of quantifying game and animation performance in terms of natural, native units—time—rather than alternatives like frame rates. Let me explain why.
Imagine you’re comparing two GPUs. One averages 30 FPS and another averages 60 FPS in the same game. One might see that result and say “GPU X is 30 FPS faster than GPU Y,” and that statement would be true—in that specific context. But a frame per second is an elastic concept, depending on how fast we’re going. Take another example where GPU X runs a game at 120 FPS, and GPU Y runs it at 150 FPS. That is also a 30 FPS delta—in a rather different context.
In the first example, the delta between the GPUs works out to 16.7 ms per frame—a notable gap. In the second example, though, the 30-FPS delta amounts to 1.7 ms per frame. One of these things is not like the other.
In short, additive FPS differences have no consistent meaning.
That’s because at higher frame rates, inter-frame values grow very small in a hurry. Let’s illustrate this point with a plot of the non-linear relationship between FPS and frame times.
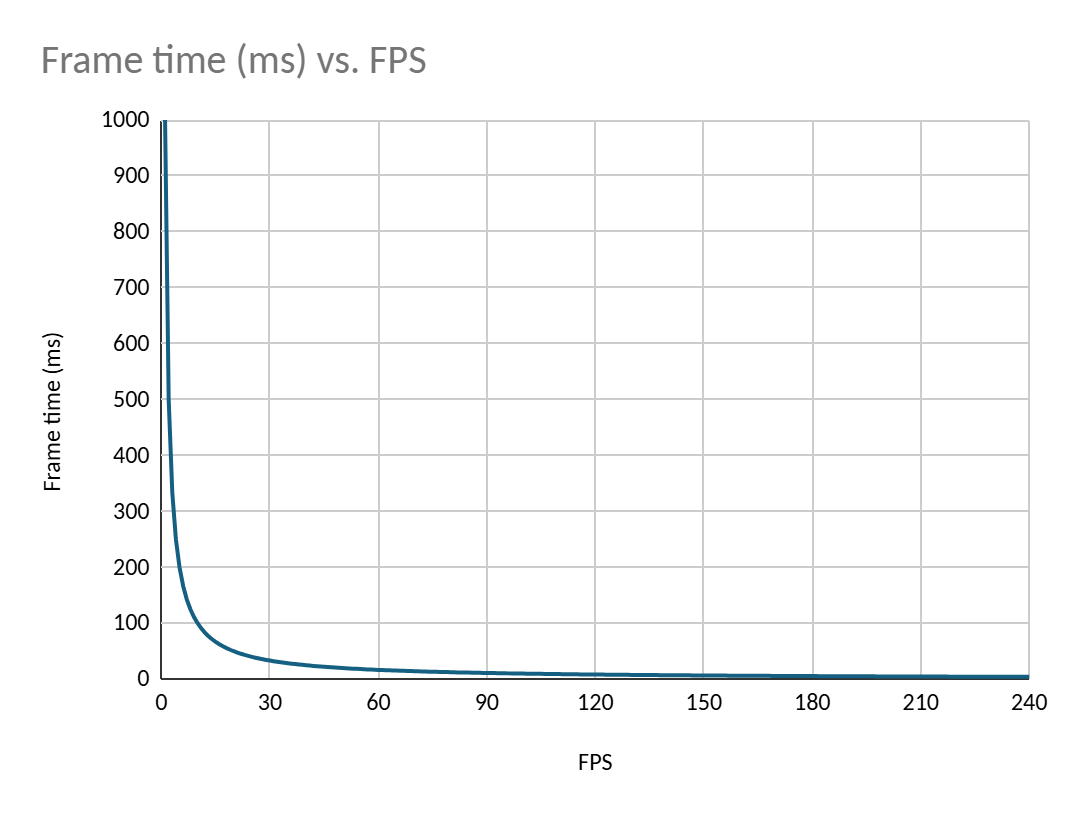
Beware someone selling you a CPU that’s “better for gaming” because it runs your favorite e-sports title at 240 FPS while the competition can “only” hit 210 FPS. That’s a delta of 0.6 ms/frame, which ain’t much. You might want to consider other factors.
My sense is that, when in doubt, the best language to use to describe differences in game performance is just time in milliseconds. It’s clarifying.
Displays are insane now
I’m writing these words using a 32” 4K desktop monitor. It’s an OLED with a 240 Hz refresh rate, variable refresh rate support, and near-instantaneous pixel response times. It has a special gaming mode where it does 1080p at 480 Hz—not to mention that it has perfect blacks, crazy peak brightness in HDR, and a color gamut wider than Alaska.
It makes the sharp folks at Blur Busters behind testufo.com seem delusional, because it passes almost every test without showing any artifacts. (“What, exactly, are these people on about?”)
This, my friends, is completely frigging bonkers.
I hope folks appreciate what’s possible now. And I hope, instead of fretting about current GPU and memory prices, gamers realize the best upgrade they can make may well be a better monitor—for fluidity, responsiveness, visual fidelity, and sheer impact.
Minor frame-time variations are vastly less disruptive on a more forgiving display. The FPS vs. frame time plot above can also function as a refresh rate vs. quantization step plot, since the math is the same. At 240 Hz, like on my current monitor, the quantization step between fixed-rate screen updates is 4.2 ms—one-quarter of the interval on a 60 Hz display. Whenever the GPU has a new frame ready, you’re going to see it quite soon, perceptually speaking.
This plot helps illustrate the relative potential for smoothness.
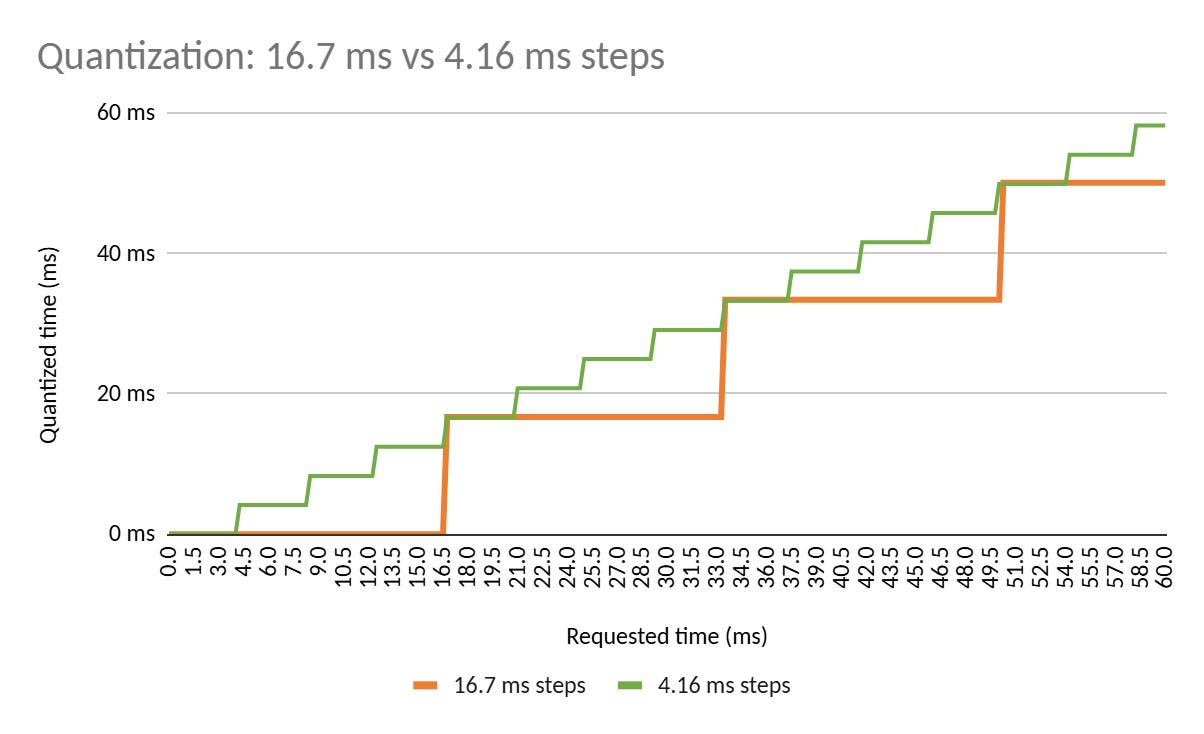
So yes, this is good.
This new display reality ought to inform how we spec PCs and how we think about minimum requirements for gaming. In my view, one should spec a gaming system with a fast display, and it’s worth giving up a tier or two in terms of the GPU or CPU spec in order to do so.
Is VRR cooked, chat?
One question I have in this context—and I legitimately don’t know the answer—is whether variable refresh rate features like G-Sync and FreeSync still add real value and have a bright future. I’d like to look further into the exact, delivered benefits of the ability to vary update rates compared to something like a 240 Hz OLED running at a fixed refresh rate. (For this comparison, I’m assuming vsync is enabled in the fixed-refresh case, so neither solution tears.) We know those benefits are increasingly marginal as fixed refresh rates rise, given the shrinking quantization steps illustrated above. And I know that some displays, particularly LCD panels, have had real trouble dealing with the combination of varying refresh rates while supporting HDR-class dynamic brightness.
Will the simplicity of a fast, fixed refresh rate win out in the end? Perhaps not for mobile devices where power consumption is king, but everywhere else? I dunno.
Wrapping up
That’s probably about enough for now. I guess I had plenty to say after over a decade without publishing something like this. There are still more topics I’d like to address, and I’ll call my shot on two of them.
First, one of the most difficult lessons I learned from working in the industry is that having the right metrics without the right data isn’t worth much. I was able to influence some of the places where I worked to use frame-time-based metrics in their performance reporting, but typically, they were reporting those metrics against data sets produced by scripted benchmarks, not actual gameplay sequences. The results were therefore of limited value in understanding how our product compared to the competition in real-world use. Turns out big companies are loath to pay people to play video games for testing. Engineers and engineering leaders like automation—even at the cost of actual insights.
I think the rise of AI has created an opportunity for tools to capture something much more like real-world gameplay. I’m curious to see what’s possible in the coming years.
Second, one of the unsolved problems in gaming animation remains the synchronization between the physical simulation in the game world—which dictates the content of each frame of animation—and the time when the frame is displayed to the user. Different game engines vary in how they handle this stuff, but from what I gather, the answer is still generally just “go fast enough, and it will all work out.” Usually it does, more or less, but more precise synchronization might pay surprising dividends. I know work is being done on this front, and I’d like to revisit the subject again soon.
I haven’t even touched on a bunch of other fascinating developments in gaming and graphics, like the huge software improvements in Linux for running Direct3D games, neural upscaling, or frame interpolation. I suppose that means there’s room for more of this sort of thing.
If you’d like to see more, please subscribe to Damage Labs and let me know what you’d enjoy seeing covered. With enough support, I’d like to turn this into a paying gig and continue writing regularly. We’ll see where it goes.
We are so back!
bring it!